
Skip to content
Ignite GP

Ignite Performance Lab

The Ignite Performance Lab

Every lap
tells a story.

Our coaches combine what they see with what the data proves. GPS, telemetry, onboard video and driver comparison allow us to identify precisely where performance is being gained — and where it is being left behind.

Speed trace · one lap · driver vs coach reference

Overlay

Driver

46 km/h

Coach reference

49 km/h

Delta

-3.1

Hover the trace to scrub the lap

4050607080T1T2T3T4T5T6T7T8
Driver Coach reference Time left on the tableIllustrative data

One corner. Three numbers.

Data tells us where the time went. Coaching teaches the driver how to find it.

A single corner comparison says more than any paragraph about “world-class telemetry”. Entry, minimum and exit speed against a reference — and the time that represents. Then a specific, practicable instruction, tried in the next run and checked in the next trace.

Turn 1

km/h

PhaseChrisCoach refΔ
Entry6364-1
Minimum4750-3
Exit5861-3

Time opportunity

0.14 s

Three km/h of minimum speed is the difference between a tidy corner and a fast one. That is a braking-release problem, not a bravery problem — and it is coachable.

Illustrative example — the numbers show the method, not a published lap

Fourteen areas

What the Lab does.

GPS analysis

Turn-in, apex and exit points against the reference line, corner by corner.

Telemetry

Speed, RPM and (where fitted) throttle and brake traces, overlaid lap on lap.

Lap overlays

This lap against the driver's best, and against the coach reference.

Sector analysis

Which part of the lap is improving and which is not — across a session, a weekend, a season.

Braking analysis

Not where the driver brakes. How they release.

Onboard video

Hands, head and eyes, synchronised with the trace.

Coach comparison laps

A coach drives the kart; the driver sees the difference in numbers, not adjectives.

Engine benchmarking

Engines compared on the data so that 'the engine feels slow' is either true or not.

Chassis setup

Recorded changes, recorded results. What worked in November is known in February.

Tyre management

Pressures, temperatures and wear across a run — and how the driver's style affects them.

Driver fitness

Neck, core, grip and cardio for drivers whose bodies are now the limit.

Reaction training

Start reactions and first-corner decisions, trained and timed.

Simulator coaching

Track learning and procedure work off the circuit.

Race strategy

Starts, heats, tyre choice, when to attack and when to bank the points.

Over a season

The Development Score, fed by the Lab.

Lab sessions feed the driver's profile directly: braking, cornering and consistency scores come from the data, not from an impression.

  • Baseline session with reference laps
  • Objective set per block of sessions
  • Data pack and Driver Report after every race weekend
  • Score reviewed with the family each block

Ignite Development Score

Jan → May

JanMarMay
  • Control
    5.2→7.0
  • Consistency
    4.7→7.4
  • Braking
    4.1→6.6
  • Cornering
    4.9→6.9
  • Racecraft
    3.8→6.1
  • Technical understanding
    3.5→5.8
  • Focus
    5.0→6.8
  • Confidence
    5.4→7.2
  • Fitness
    4.6→6.3
  • Race preparation
    4.2→6.7

Illustrative profile. Scores are set by the coaching team after each block of sessions.

Advanced driver coaching.

lab

Ignite Performance

For competitive drivers chasing tenths. Data-led coaching combining GPS, telemetry, lap overlays and coach comparison laps with setup, tyre and race-strategy work.

  • Telemetry and GPS analysis
  • Coach comparison laps
  • Setup and tyre management
  • Race strategy and post-race review

Price on request

per day
Enquire
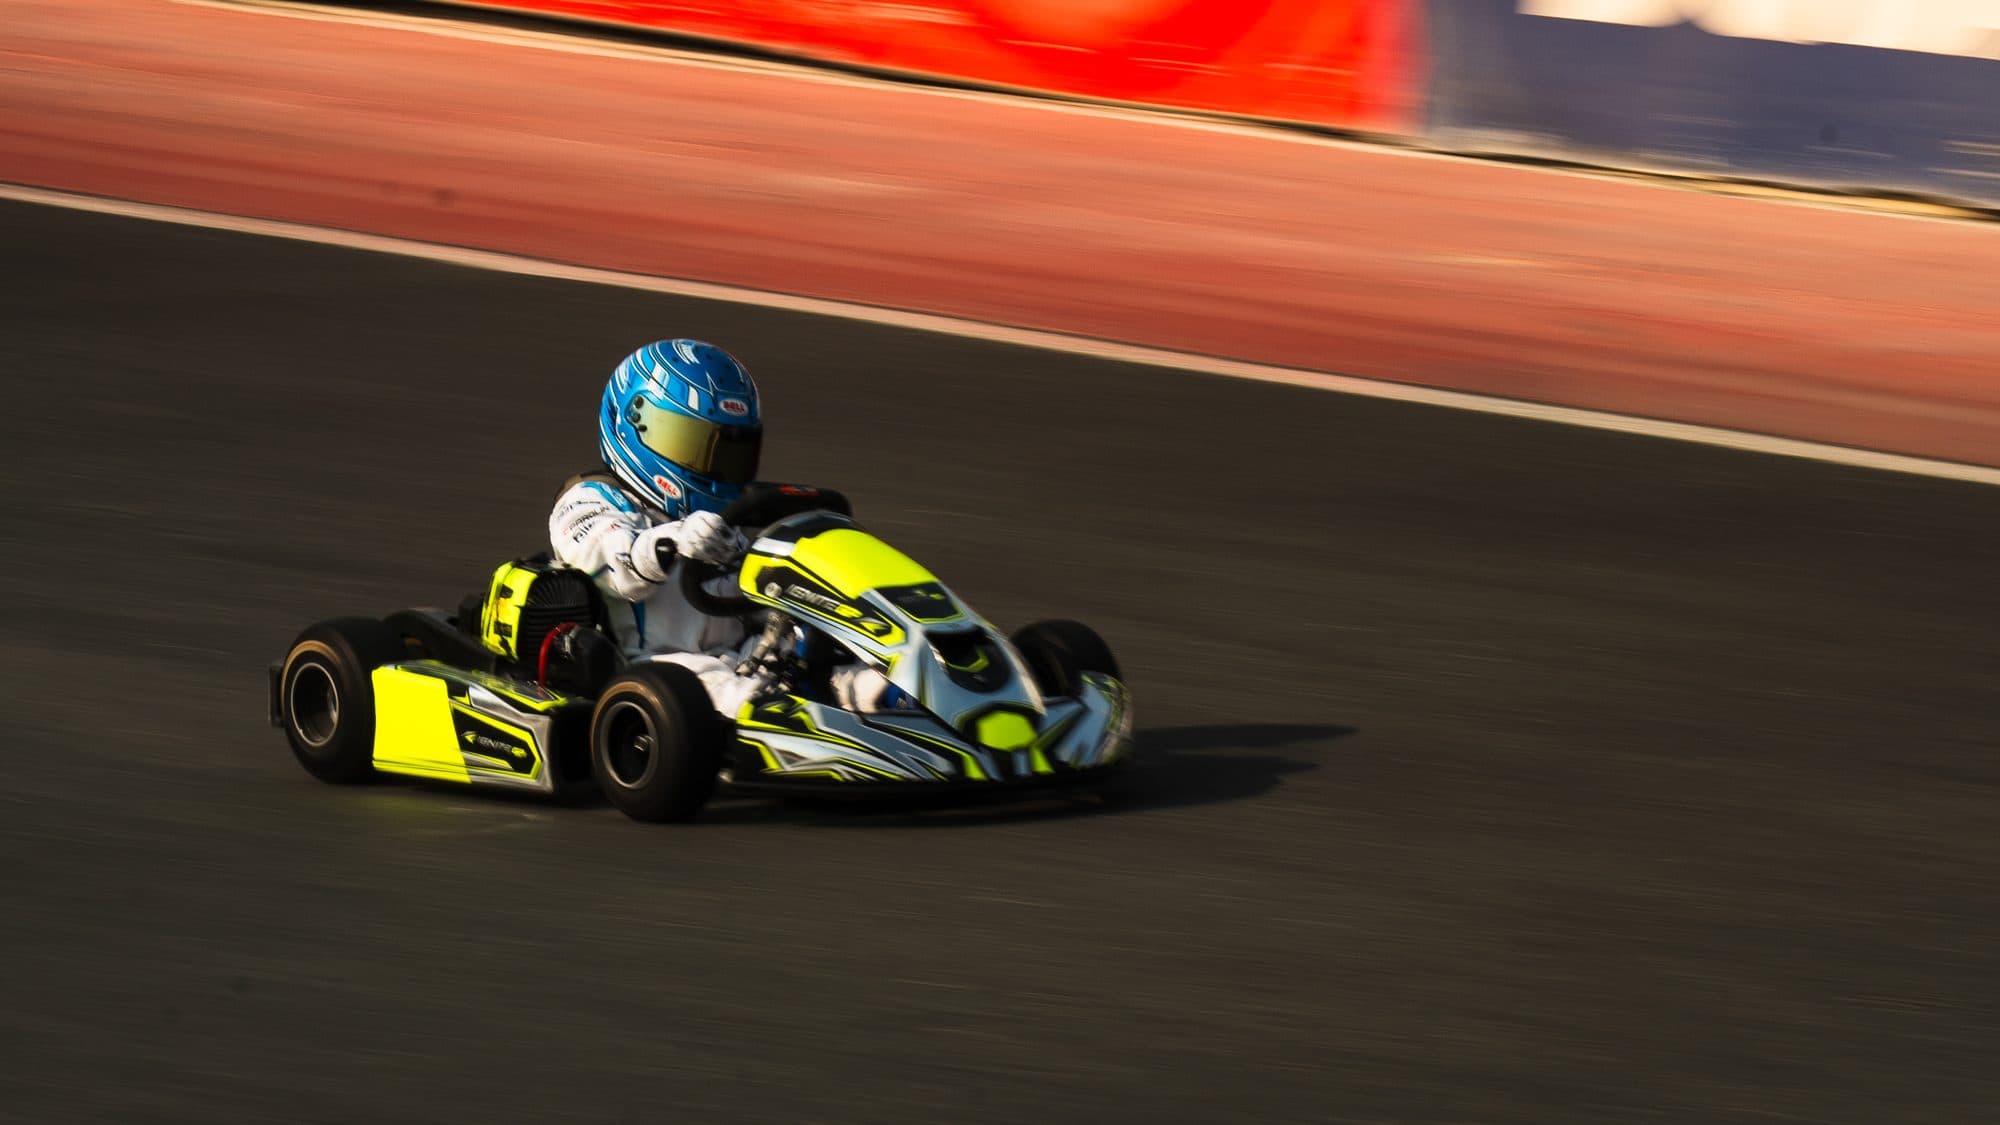
Bambino kart at full speed, panned so the track and barriers blur past

We're losing two tenths and don't understand where. Ignite will find it in the data.

Why the Lab exists